Pages
26
Comparison of resonances of [] tin isotopes at the same frequency
August 25, 1949.
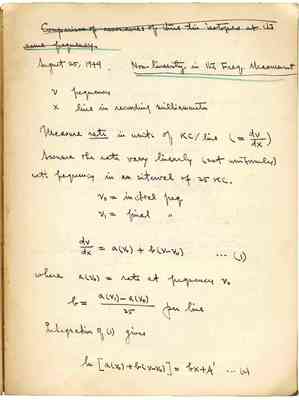
Non-linearity in the Freq. Measurement
ν frequency
x line in recording milliammeter
Measure rate in units of KC/line (= dν/dx)
Assume the rate vary linearly (not uniformly) with frequency in an interval of 25 KC.
ν0 = [?] freq.
ν1 = final "
where a(ν0 = rate at frequency ν0
per line
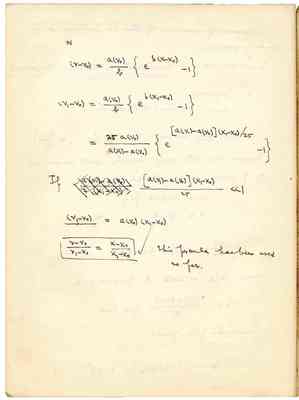
Integration of (1) gives
28
August 26, '49
Fine tin powder was made from CP tin by filing. Total amount = 7.5 gms in 3 cc. Density = 2.5 gms/cc
A search coil was immersed in this tin powder. No reduction of radio signal by comparison of the output with that by without tin powder. No shielding effect was observable.
Sample Sb #4
Dissolve 21 gms of SbCl₃ into 12 c.c of warm soln. Stand for a few days. Pour the 7 cc clear soln into a test tube & add two c.c of conc. HCl. The precipitate rejected. Contains min SbCl₃ 1 gm/c.c. ~ 5 Molar of Sb
29
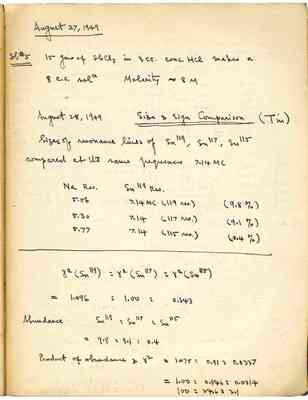
August 27, 1949 Sb #5 15 gms of SbCl₃ in 3 cc. conc. HCl makes a 8 c.c. soln Molarity ~8 M
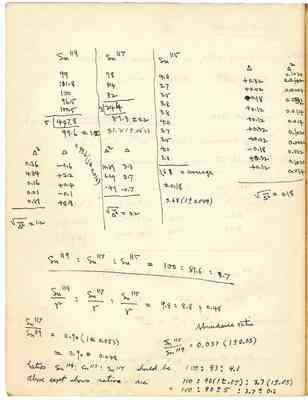
August 28, 1949 Size & Sign Comparison (Tin)
Sizes of resonance lines of Sn119, Sn117, Sn115 compared at the same frequences 7.14 MC
| Na Res. | Sn119 | |
|---|---|---|
| 5.06 | 7.14 MC (119 res) | (9.8%) |
| 5.30 | 7.14 (117 res) | (9.1%) |
| 5.77 | 7.14 (115 res) | 0.4 % |
γ² (Sn119) : γ²(Sn117) : γ²(Sn115) = 1.096 : 1.00 : 0.843
Abundance Sn119 : Sn117 : Sn115 = 9.8 : 9.1 : 0.4
Product of abundance & γ² = 1.075 : 0.91 : 0.0337 = 1.00 : 0.846 : 0.0314 100 : 84.6 : 3.1
30
Su^119 Su^117 Su^115 99 78 4.0 101.8 84 3.7 100 82 3.5 96.5 ----- 3.8 100.5 244/3 3.8 -------- 4.0 5/497.8 81.3+=4.2 3.7 99.6+=1.5 81.311+=.052 3.5 99.6+=1.5 4.0 3.8

